


Advanced Slash
Packaging three statistics into a modern slash line for player evaluation

As I learn more about modern metrics and statistics in baseball, I find myself filtering and sorting on those stats most often to get a better understanding of an offensive player’s production. The stats are easy to access at sites like FanGraphs. But at this point, we kind of just reference each stat individually as we look up the data. One of the nice things about the triple slash line is that we can package three common statistics together in one easy line: AVG / OBP / SLG. But there’s not a concise package of advanced stats in that simple format. Maybe it’s time we have an advanced stats version. It’s not a revolutionary idea and it’s fairly common to see these three stats in different spaces, but as a fan an “advanced slash” would be fun way to evaluate hitters more accurately in today’s game and communicate their production levels much more easily.
Component 1: On-base Percentage (OBP)
Component 2: Weighted on-base Average (wOBA)
Component 3: Weighted Runs Created Plus (wRC+)
OBP / wOBA / wRC+
I chose these three stats for specific reasons, but one of the strongest considerations for choosing OBP and wOBA is their correlation to run scoring. After correlating batting average (AVG), on-base percentage (OBP), and weighted on-base average (wOBA) to total team runs for all MLB teams from 2001-2021, here are the results:
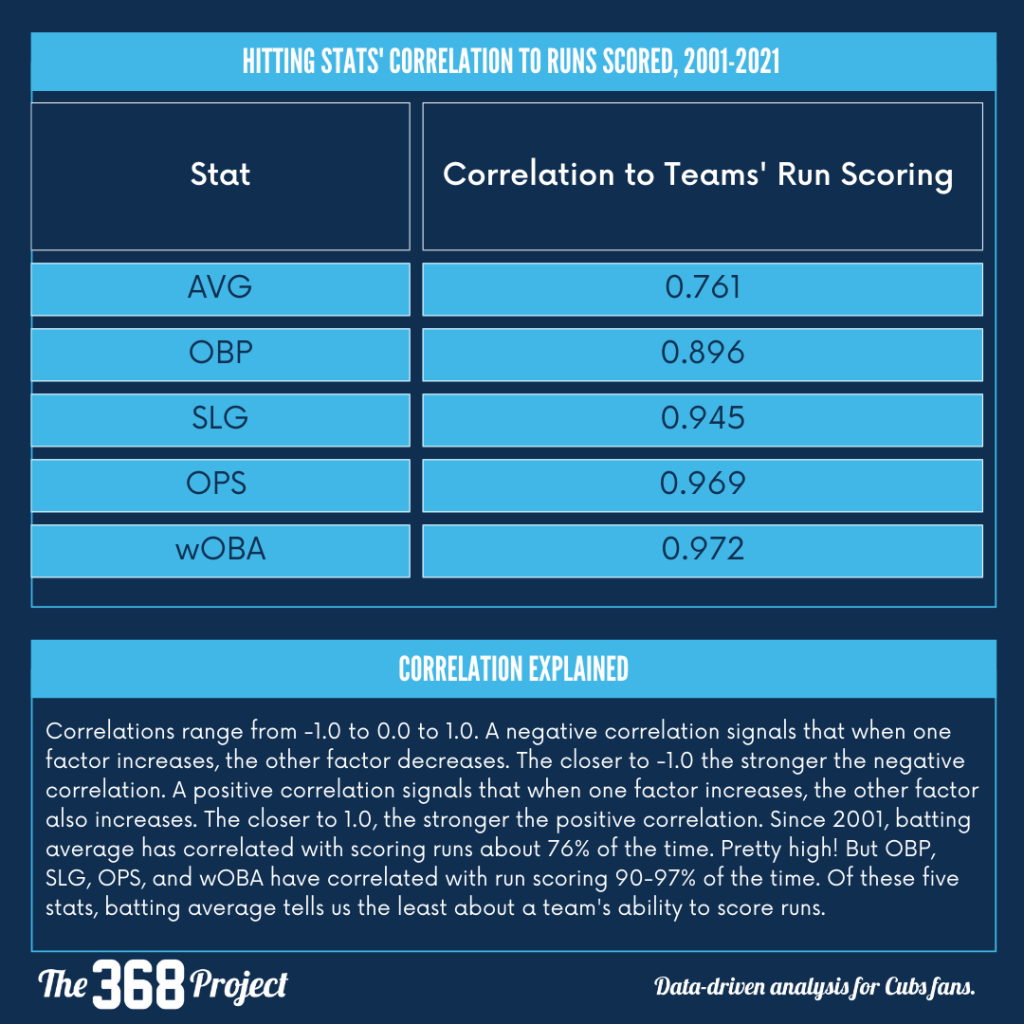
Ready to break up with batting average yet?
Component #1: On-base Percentage (OBP)
“OBP is life. Life is OBP.”
– Gary Huckabay, Cofounder of Baseball Prospectus
Let’s get the obvious part out of the way- no, OBP is not what’s considered an advanced statistic. If you've seen the movie Moneyball, OBP is the statistic Oakland A's General Manager Billy Beane leveraged as a market inefficiency to build a competitive roster under tight budget restrictions. Though OBP is no longer a hidden secret, it’s the perfect stat to begin building an advanced stat line. It's a participant in the original triple slash line, making this new “advanced slash” not a complete departure, but OBP also reaches forward to wOBA in that wOBA assigns weights to the plate appearance outcomes tracked in OBP. Both OBP and wOBA are scaled the same so if you see an OBP you know is good, that same value as wOBA would also be good . I’m choosing OBP to anchor the new “advanced slash” for its simplicity and effectiveness in describing a hitter’s frequency of getting on base.
Because outs are the single most valuable resource in the game, OBP tells how frequently a hitter makes them (1 minus OBP = percentage of outs). I prefer to think about OBP in that context more than how often a hitter reaches base (same stat, just inverse). Keith Law wrote the best summary on OBP on page 120 of Smart Baseball, “If you tell me I can only know one thing about a hitter, I want to know how often he gets on base – that is, how often he doesn’t make an out. It’s a simple number that encapsulates a couple of core skills, from the ability to make contact to plate discipline and pitch recognition, and has more predictive value going forward than batting average does.”
OBP gets straight to the point to tell us how often a hitter is safe or out. When each team only has 27 outs to work with, OBP helps us understand which players most often avoid using up those precious outs.

Component #2: Weighted On-base Average (wOBA)
I’ve written about wOBA before (check it out here) and it’s probably my favorite advanced hitting statistic. Think of it like OPS (on-base percentage plus slugging percentage) but without being the mathematical nightmare of adding two fractions with different denominators. One point of OBP is more valuable than one point of SLG, so when they’re added together to make OPS, OBP winds up undervalued. For what it’s worth, OPS does correlate highly with run scoring (similar to wOBA), but the math to get there is gross. While AVG and OBP both value all types of hits the same way, wOBA is the most comprehensive and accurate statistic in assigning specific run value weights to each plate appearance outcome a player can achieve. Having it scaled the same as OBP is a nice feature that makes wOBA easy to contextualize.

Component #3: Weighted Runs Created Plus (wRC+)
While wOBA is a comprehensive statistic it doesn’t include any calculated adjustments based on the ballpark environment. Some ballparks are easier to score runs in than others, and wOBA doesn’t correct for that. That means we would assume a wOBA value at a hitter-friendly park where it is notoriously easy to score runs, holds the same value as a wOBA in pitcher-friendly ballpark where it’s more difficult to score runs. And that’s not true. That’s where wRC+ provides additional clarity.
FanGraphs defines wRC+ as “a rate statistic for hitters that weights each offensive action and controls for league and park effects.” We can draw a straight line from wOBA to wRC+ (we pass through another stat called weighted runs created (wRC) first, but wRC+ is a little more intuitive to interpret so we won’t get off at the wRC exit). wRC+ builds on wOBA in that it’s park-adjusted, so it takes into account the different run-scoring park environments hitters will encounter. wRC+ is also scaled to league average, and the league average value is set at 100. If a hitter produces a wRC+ of 90, he is 10% below league average run scoring production whereas a wRC+ of 115 would be 15% above league average run scoring production.
If you’re looking for one stat that would tell you all you need to know about a hitter’s production, this is the best one we have available in 2022.

The Advanced Slash in Practice
Let’s take a look at the Cubs' team offensive stats and package them in the new advanced slash format:

In a triple slash format, this would read: .321 / .316 / 102 in the full season split and .322 / .300 / 91 in the RISP split. This means on the full season through July 27:
Cubs hitters reach base 32.1% of the time (league average OBP is .312 or 31.2%)
the Cubs hit .316 wOBA when those plate appearance outcomes tracked in OBP are weighted to their actual value in producing runs
the Cubs' offensive production is 2% above league average
These stats show that the Cubs are hitting a little bit above league average so far in 2022, but struggle to produce to the same level with runners in scoring position. By month, the Cubs were a top-10 offense in April and June, but in the zip code of a bottom-10 offense in May and July.

Because OBP and wOBA are scaled the same, OBP could be a higher value than wOBA. In the traditional triple slash line, we’re used to seeing AVG < OBP < SLG in ascending order. The advanced slash would be a little different visually. But if we think about the advanced slash in increasing order of complexity, it’s easy to remember OBP is first, wOBA second, and wRC+ third. What I like most about packaging these stats together is how easy it becomes to communicate three impactful stats in the same format as the traditional slash line.
If you could choose three stats for a modern slash line, which would you want included? Let me know your thoughts!
